
One of the reasons I like staffing a NOAA/National Weather Service booth at aviation-related events (such as the recent Hawaii Aviation Day at the Hawaii State Capitol) is because of the questions that pilots ask. If one person asks a question, chances are there are others out there wondering the same thing. This article will highlight a few sources of weather information available on the NWS Honolulu website that may be useful but not well known, and also introduce an initiative that’s designed to improve communication between our office and community groups interested in improving weather safety and preparedness.
Tag Archives: gach
Winds Aloft: Sources of Information
The Summer 2016 newsletter article on trade wind inversions referenced the weather balloons we launch twice a day from Lihue and Hilo, which measure winds aloft in addition to temperature and moisture. In this article we’ll look at two additional sources of wind information: radar wind observations and the automated winds aloft forecasts.
Trade Wind Inversions
In the Winter 2014 newsletter, I talked about trade winds and briefly touched on trade wind inversions. Inversions have a big impact on the weather we see in Hawaii, and knowing more about them may be of interest to pilots.
What Is An Inversion?
Temperature normally decreases with height in the atmosphere. (The higher you go, the colder it gets.) For dry air, the temperature drops about 5.4°F for every 1000 feet, or about 9.8°C for every kilometer. An inversion is a layer where the temperature either remains the same or increases with height. It is the result of an outside force, such as a change in airmass along a front where warm air overruns cold air. The typical driving force we see in Hawaii associated with the trade winds is due to sinking air associated with high pressure systems.
Low Level Wind Shear
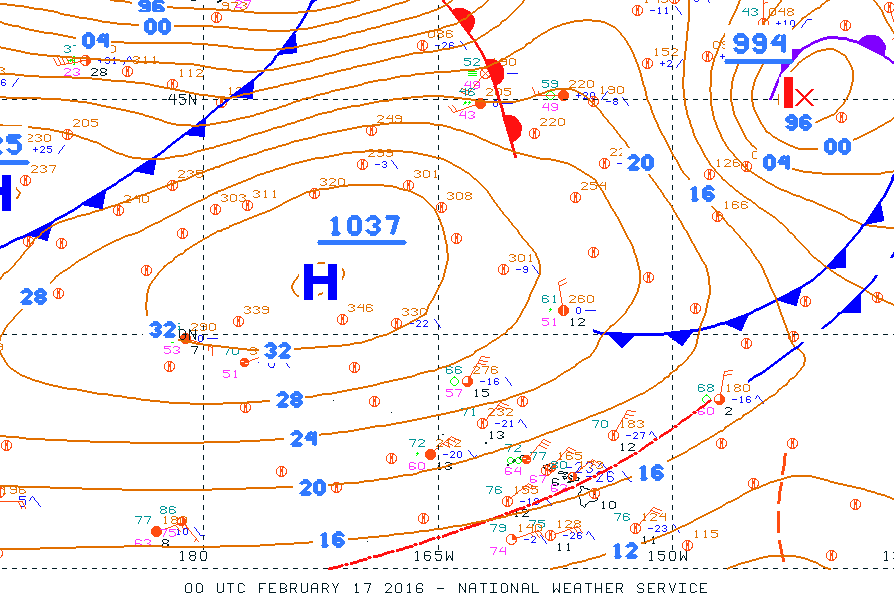
Surface analysis from 2 pm HST 2/16/16 showing strong high pressure northwest of Hawaii.
On February 16th, 2016, a 1037mb high northwest of the state brought strong and gusty northeast trade winds to the islands. We received many reports of low-level wind shear, some which we were due to non-convective wind shear and some of which were due to convective mixing and gusty winds. What are the different types of wind shear, when is wind shear included in a TAF, and what can you do to mitigate the risk from it when you fly?
When Weather Radar Measures More Than Weather
Note: I originally wrote this article for the General Aviation Council of Hawaii Spring 2015 newsletter. Hopefully you will find it interesting and educational as well. –JB
(For more background on weather radar basics and an overview of the different radars in Hawaii, see the GACH newsletter from Fall 2012.)
Not everything you see on a weather radar image is necessarily a weather feature. Weather radars use a series of complex algorithms to filter out energy from non-meteorological returns. In general terms, if an object is stationary, then it’s most likely not weather-related. For example, a mountain will reflect a lot of energy back to the radar. Luckily, mountains don’t move (much), and the radar will identify and filter out these types of returns. However, no algorithm is perfect, and some returns make it into the final reflectivity product even though they’re not actually precipitation. Here are a few of the more common non-meteorological returns we see in Hawaii:
El Niño and Hawaii Weather
Note: I originally wrote this article for the General Aviation Council of Hawaii Spring 2014 newsletter. While this seasonal outlook was from last spring, the typical impacts during El Niño remain consistent. Hopefully you will still find it interesting and useful. –JB
The spring 2014 forecast [view the latest forecast] from the National Weather Service Climate Prediction Center indicates that there is a greater than 50 percent chance that El Niño conditions will develop during the summer of 2014, and continue into the winter of 2014-2015. What is El Niño and what does it mean for weather in Hawaii?
Trade Winds
Note: I originally wrote this article for the General Aviation Council of Hawaii Winter 2014 newsletter, hence the aviation focus. Hopefully you will find it interesting and educational as well. –JB
In the last article we discussed severe weather features such as tornadoes and water spouts. These weather phenomena are not common, especially in Hawaii. For the bulk of the year our weather is driven by the trade winds. In this article we’ll take a look at what drives the trades, how they affect our weather, and the types of impacts to aviation that we may see from them.
Rotating Columns of Air: Tornadoes, Waterspouts, Funnel Clouds and Dust Devils
Note: I originally wrote this article for the General Aviation Council of Hawaii Fall 2013 newsletter, following a particularly busy couple of weeks. Hopefully you will still find it interesting and educational. –JB
During a period of unsettled weather at the beginning of this month [October, 2013], National Weather Service spotters have reported water spouts, funnel clouds, and dust devils on many different days. We have also received a number of questions about the differences between these features and others, such as tornadoes. This is a good opportunity to review the differences between these features, and look at the hazards to aviation that they pose.
Introduction to Satellite Imagery
Note: I originally wrote this article for the General Aviation Council of Hawaii Spring 2013 newsletter. Hopefully you will find it interesting and educational as well. –JB
Satellite imagery is very useful for identifying, tracking, and forecasting weather systems. It is even more important in Hawaii, given our remote location and lack of nearby observations.
Geostationary Satellites
Some of the most common types of satellite images are from geostationary satellites. Geostationary satellites orbit the Earth over the equator at an altitude of about 22,300 miles. At this altitude, the speed of the satellite matches the rotation of the Earth, and the satellite remains over the same location on the surface. Because it remains stationary over the same location, a geostationary satellite can provide constant monitoring of clouds and weather patterns.
Low-Level Turbulence Climatology
Note: I originally wrote this article for the General Aviation Council of Hawaii Winter 2013 newsletter. The results weren’t quite what I expected, but still proved interesting. Instead of highlighting where turbulence occurs, the pilot reports instead highlighted areas where aircraft tend to fly (i.e., Oahu, mainly with reference to HNL or CKH). –JB
In the Winter 2012 newsletter, I talked about mechanical turbulence and mountain waves. Moderate turbulence is the most common reason for an AIRMET around the Main Hawaiian Islands. In the 12 year period from 2001 to 2012, an AIRMET for turbulence was in effect for at least a portion of the day for over half of the time. By contrast, an AIRMET for mountain obscuration/IFR conditions was in effect for less than a quarter of the time, and an AIRMET for icing was in effect for less than five percent of the time.
Even though turbulence is common, there is little specific information available as to where it occurs (other than “over and downwind of the mountains”). The National Weather Service in Honolulu will begin a project this summer to quantify where turbulence is most likely to be encountered. By taking pilot reports of turbulence and sorting them based on atmospheric stability and low-level wind fields, we will be able to map where turbulence occurs during different weather patterns.