Note: I originally wrote this article for the General Aviation Council of Hawaii Winter 2012 newsletter. Hopefully you will find it interesting and educational as well. –JB
Two common types of turbulence associated with mountains are mechanical turbulence and mountain waves. Mechanical turbulence is a result of an obstruction to the wind flow. Obstructions can range in size from trees and buildings to rough terrain and mountains. The degree of the turbulence depends on the strength of the wind speed and the size and shape of the obstruction. The stronger the wind or the rougher the terrain, the stronger the turbulence will be.
Mechanical turbulence usually occurs within 20 miles of the mountain, and is located at an altitude near or below the height of the terrain. As a rough estimate, low-level winds of 20 knots may lead to light turbulence, winds of 25 knots may lead to moderate turbulence, and winds greater than 30 knots may lead to severe turbulence.

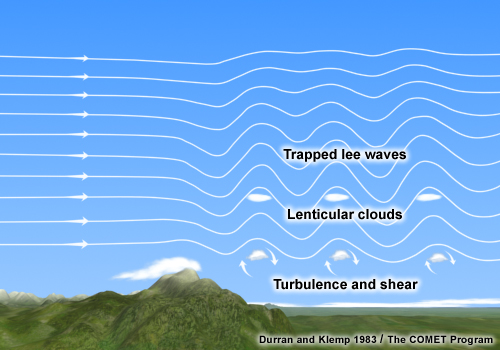
Trapped lee waves downwind of a mountain range. Image courtesy of COMET/UCAR
For mountain waves, there are two main types: trapped lee waves and vertically propagating mountain waves. Mountain waves are a type of gravity wave, meaning that they are forced to oscillate because of gravity. (Waves on the ocean are another type of gravity wave.) When strong winds blow across a mountain, the air is forced upward by the terrain. If the atmosphere over the mountain is stable (that is, if the temperature of the air increases with height, which is typically the case in Hawaii due to the trade wind inversion), then the air that is forced upward by the mountain will be more dense than the air around it. The air will sink back toward the ground, where it will begin an up and down oscillation. These oscillations can continue for over 50 miles downstream of the mountain, and are known as trapped lee waves.
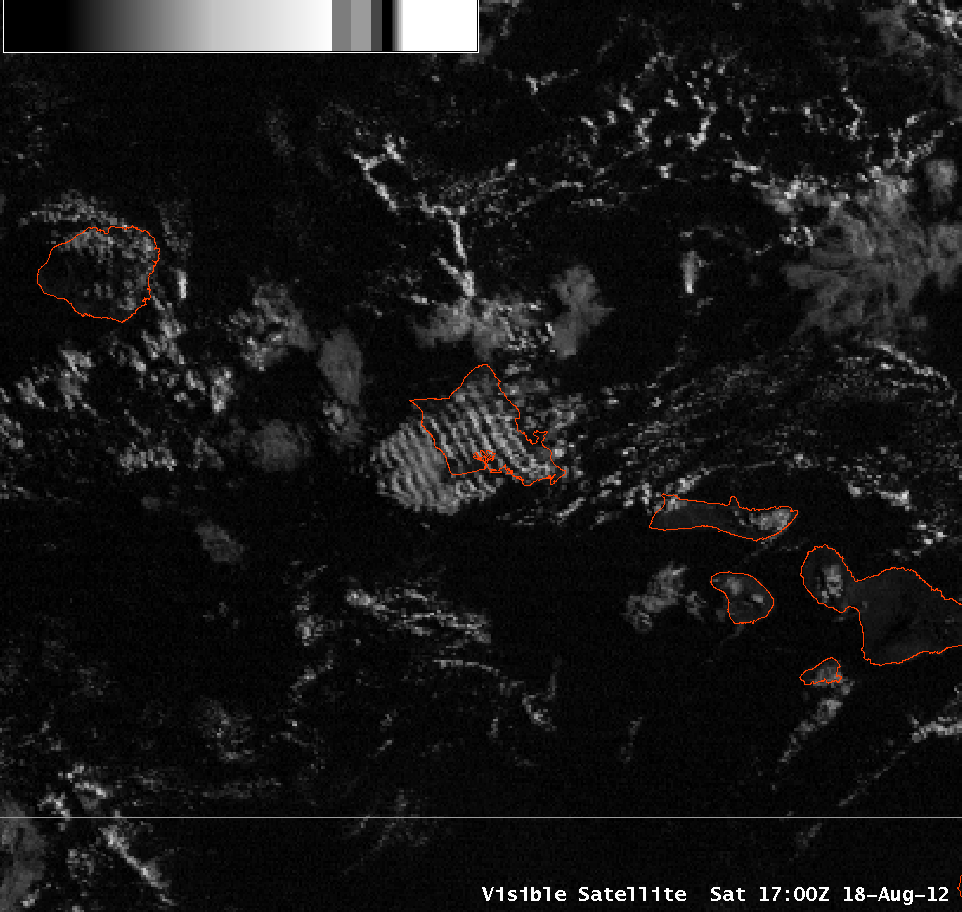
Visible satellite image of wave clouds over and downstream of Oahu under strong southwest winds.
If the atmosphere has enough moisture, the trapped lee waves may be visible as wave clouds. Wave clouds form near the crests of the trapped lee waves, and appear as distinct lines that are oriented parallel to the terrain and perpendicular to the wind. While the clouds may appear to remain stationary, the wind blowing through them is actually quite strong.
Trapped lee waves tend to form when the low-level flow is perpendicular to the mountain range, there is an inversion located near the top of the ridge, and ridge-top winds are 25 knots or greater. Wave clouds typically form at an altitude within a few thousand feet of the ridge top. Turbulence is most often encountered below the crests of the mountain waves, or, in other words, below the wave clouds if they are present.
Trapped lee waves are the most common type of mountain wave in Hawaii, because of the persistence of the trade wind inversion. However, if the atmosphere is unstable, vertically propagating mountain waves may form. In this situation, there is no inversion for the mountain waves to reflect off of to begin the oscillation. Instead, the mountain waves will spread upwards through the atmosphere, and also tilt upstream in the direction from which the wind is blowing. Vertically propagating mountain waves may extend through the troposphere and even into the stratosphere.
The presence of vertically propagating mountain waves does not necessarily mean that there will be turbulence. If the amplitude of the waves becomes large enough, they become unstable and break–just like ocean waves–which leads to turbulence. If the waves don’t break, an aircraft may encounter significant wave action, but not the severe to extreme turbulence that may be encountered within breaking mountain waves.
The conditions necessary for mechanical turbulence and mountain waves are similar: strong winds blowing across a mountain. Whether the cause is mechanical turbulence or mountain waves, the results can be the same: turbulence. As a basic rule of thumb, be alert for turbulence if low-level winds are 25 knots or greater. The National Weather Service will issue an AIRMET if moderate turbulence is expected, and will issue a SIGMET if severe turbulence is expected. When an AIRMET or SIGMET is in effect, the forecaster will also provide the reasoning behind those products in the Area Forecast Discussion. These products (and others) are available through the aviation page of the WFO Honolulu website.
John Bravender
Aviation Program Manager
National Weather Service Honolulu