
Note: I originally wrote this article for the General Aviation Council of Hawaii Spring 2013 newsletter. Hopefully you will find it interesting and educational as well. –JB
Satellite imagery is very useful for identifying, tracking, and forecasting weather systems. It is even more important in Hawaii, given our remote location and lack of nearby observations.
Geostationary Satellites
Some of the most common types of satellite images are from geostationary satellites. Geostationary satellites orbit the Earth over the equator at an altitude of about 22,300 miles. At this altitude, the speed of the satellite matches the rotation of the Earth, and the satellite remains over the same location on the surface. Because it remains stationary over the same location, a geostationary satellite can provide constant monitoring of clouds and weather patterns.
The United States operates two Geostationary Operational Environmental Satellites (GOES), which are commonly referred to as GOES-West and GOES-East. GOES-West is located near 135°W longitude, and GOES-East is located near 75°W longitude. GOES-West covers the Eastern Pacific, and is the primary satellite for Hawaii. For the Western Pacific, the Japan Meteorological Agency (JMA) operates a geostationary satellite that is located near 145°E. It is called the Multi-functional Transport Satellite (MTSAT).
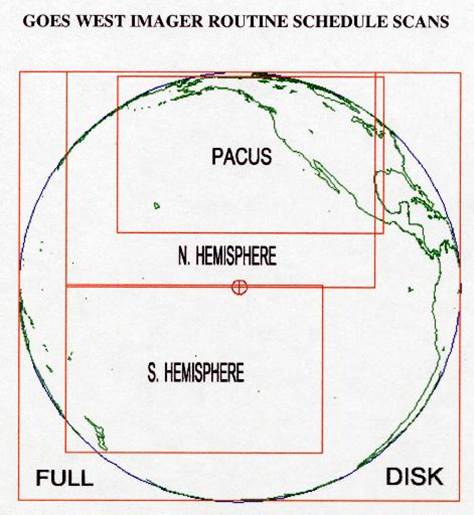
Map of the overlapping scan sectors for GOES-West.
Even though a geostationary satellite provides “constant” coverage over one area, it doesn’t provide continuous images like you would see from a webcam or security camera. A “Full Disk” scan, where the satellite captures an image of everything in view, can take about 20 minutes. Because of the time needed for the imager and other sensors, the area under the satellite is split into sectors, and each sector is scanned at a different time. The PACUS sector is scanned at :15 and:45 past the hour; the northern hemisphere sector is scanned at :00 and :30 past the hour; and the southern hemisphere sector is scanned at :22 and :52 past the hour. In addition, a full disk scan that captures everything in view is created every three hours. Because of the overlap between the PACUS and northern hemisphere sectors, we receive satellite images of Hawaii every 15 minutes.
Types of Satellite Images
The current GOES captures images in five different channels that are centered on different wavelengths of light. The three most common channels are visible (0.6 micron wavelength), infrared (10.7 micron), and water vapor (6.7 micron).
 The visible channel shows reflected sunlight. These images have the greatest resolution (1km per pixel), but are only available during the daytime. They are useful for identifying and tracking most cloud features. They can also be used for identifying non-cloud areas, such as snow cover atop Mauna Kea and Mauna Loa. Because this channel relies on reflected light, it is the closest of all satellite images to a picture taken with a camera.

 The infrared (IR) channel shows the temperature of the clouds. These images have a lower resolution (4km per pixel), and are available day and night. They are useful for tracking clouds at night, and also to gauge the strength of thunderstorms or other tall clouds. Because the temperature decreases with height in the atmosphere, taller clouds will have a colder IR signature. Changes in the temperature of the clouds can also indicate strengthening or weakening; if thunderstorm cloud tops are cooling, it means that they are taller and that the thunderstorms are strengthening.
 The water vapor channel shows moisture in the middle and upper levels of the atmosphere, generally between 13,000 feet and 40,000 feet. These images have the lowest resolution (8km per pixel), and are available day and night. They are useful for identifying large-scale weather patterns (e.g., lows, highs, jet streams) in the upper atmosphere, and can also be used to help identify areas of clear air turbulence.

There are also two other infrared channels (3.9 and 13.3 microns). These channels are used for more specialized purposes, such as detecting fog and low status clouds or identifying the heat signature from wildfires. Different channels can also be combined together for different purposes, such as to detect volcanic ash.
Current Satellite Images
You can view the latest satellite images for Hawaii and the greater Pacific on the satellite page of the WFO Honolulu website.
John Bravender
Aviation Program Manager
National Weather Service Honolulu