
The Summer 2016 newsletter article on trade wind inversions referenced the weather balloons we launch twice a day from Lihue and Hilo, which measure winds aloft in addition to temperature and moisture. In this article we’ll look at two additional sources of wind information: radar wind observations and the automated winds aloft forecasts.
Radar Wind Observations
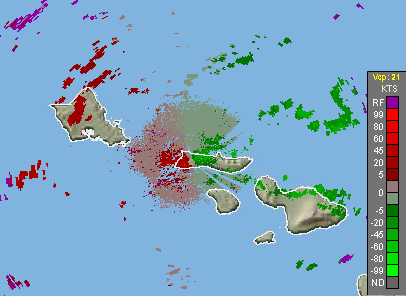
Example of a base velocity image from the Molokai radar. The transition from green (toward the radar) to red (away from the radar) is representative of the ongoing strong trade winds out of the east-northeast. Image from 10/30/2016.
Previous articles on weather radar basics and non-weather returns didn’t cover the “D” portion of the WSR-88D. (Apparently they also didn’t define the commonly-used acronym, which stands for “Weather Surveillance Radar-1988 Doppler”.) One of the major additions with these radars was the ability to measure wind as well as rain. The radar sends multiple pulses (up to 1,300 per second) and measures how far objects travel between pulses using a phase-shift in the radar beam. This provides a good estimate for how fast the object is moving and, by extrapolation, how fast the wind is moving it. The drawback is that this method can only measure movement toward or away from the radar. On most radar images, movement toward the radar is usually colored green and movement away from the radar is colored red.
On a side note, the example above from the Molokai radar is the “base velocity”, which is just the wind speed measured by the radar. The radar also takes the average motion of current storms and subtracts it from the base velocity, providing a “storm-relative” view of the velocity. This allows you to see rotation within a storm, which is an important component for determining severe weather potential.
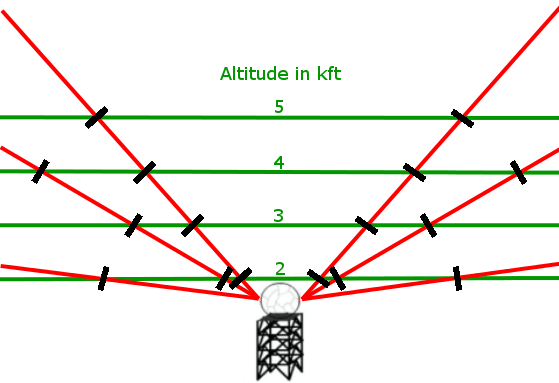
In a volume scan, the radar beam can sample the wind at a given altitude in multiple locations. The values closer to the radar (where radius of the cone is smaller) are more likely to be similar and provide more consistent wind estimates.
The radar scans a large volume of the atmosphere (using a predefined volume coverage pattern) and provides a lot of radial wind information. To make it easier to see the actual wind (instead of only the component toward or away from the radar), the radar creates a product called a Vertical Azimuth Display (VAD). At predefined altitudes, the radar collects all the velocity information from that altitude and uses it to make an estimate of the wind speed and direction over the radar.
The radar uses its full 360° view, so the VAD is most accurate when the wind field is uniform across the area. It would be less accurate if, for example, there were a front located near the radar with south winds for half the area and northwest winds for the other half; in this situation the radar would flag the wind it comes up with as highly uncertain due to the large spread in values across the area. Also, since we need something on radar to determine its velocity, the radar can only provide a VAD wind if there are reflectivity returns (e.g., rain, clouds, or even chaff).
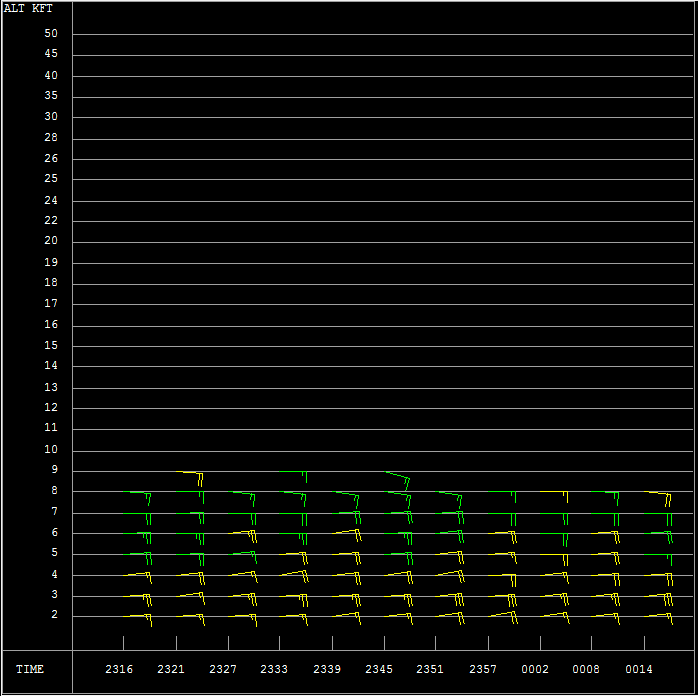
VAD Wind Profile from the Molokai radar. The wind barbs indicate direction and speed and the colors indicate reliability of the observations. The most recent scan is on the right, with past observations going farther back in time to the left.
VAD winds are calculated at multiple altitudes and combined into a product called a VAD Wind Profile (VWP). A VWP is created every volume scan (about every 4-6 minutes) for each radar site. In Hawaii, the VWP is particularly useful for low-level turbulence forecasting. since a major component of turbulence is related to wind speed. It is also useful for determining the height of the trade wind inversion. While the vertical temperature profile is measured every 12 hours using weather balloons, an inversion height can also be inferred from the height of the VWP winds. Since winds can only be determined from radar returns and the depth of trade wind showers are capped by the inversion, a good proxy for inversion height (and cloud top) is where the low-level VWP winds stop.
For day to day use, one drawback to the VWP is that it only contains wind observations for altitudes with radar returns. When conditions are particularly dry (e.g., a nice day to fly), there will be few radar returns and therefore few wind reports. Also, since it’s an observation, it won’t alert you to possible changes in the weather pattern. For that we turn to the winds aloft forecast
Wind and Temperature Aloft Forecasts
The National Weather Service runs a computer model, the Global Forecast System (GFS), every six hours. The wind and temperature aloft bulletins are automatically generated from this model, and are usually available about 2 hours after it starts. For each computer run, there are forecasts that are valid at 6, 12, and 24 hours after the model start time.
The bulletins are in a coded format that harkens back to the teletype days:
DATA BASED ON 301200Z
VALID 301800Z   FOR USE 1400-2100Z. TEMPS NEG ABV 24000

FT  1000 1500 2000 3000    6000    9000   12000   15000   18000   24000
LIH 0719 0722 0723 0827 0823+11 1018+06 0821+04 0715-01 0307-09 3010-23
HNL 0723 0725 0726 0830 0827+11 0920+07 0916+04 0906-01 9900-09 2619-22
LNY           0730 0832 1024+12 1116+07 1011+05 9900+00 2806-09 2626-22
OGG 0825 0826 0828 0833 0927+12 1216+08 1012+04 9900-01 2706-09 2625-22
KOA 0607 0805 9900 9900 9900+13 9900+08 9900+05 9900+00 2612-08 2627-21
ITO 0709 0710 0710 0816 1024+10 1209+07 0605+03 0306+00 2608-08 2629-20
This is a six hour forecast that is valid at 1800 UTC on the 30th (VALID 301800Z), but can be used for the period from 1400 UTC to 2100 UTC (FOR USE 1400-2100Z). In local time, the forecast is valid at 8 am HST on the 30th, but can be used for the period from 4 am HST to 11 am HST. Looking at HNL as an example, the wind is 070 at 23 kt at 1,000 ft; 070 at 25 kt at 1,500 ft; 070 at 26 kt at 2,000 ft; and 080 at 30 kt at 3,000 ft. At 6,000 ft, the bulletin begins to include temperatures as well; in this example at HNL, the wind is 080 at 27 kt and the temperature is 11°C.
There are a couple special values to be aware of in this format: a direction of “99” means a variable wind direction and a speed of “00” means calm winds. Also, the heights are Mean Sea Level (MSL), not Above Ground Level (AGL), which means that some heights may be below ground. For example, at Lanai Airport the first two values are missing, since 1,000 ft is below ground and 1,500 ft is too close to the ground to be free of surface effects.
These forecast bulletins are available on the NWS Honolulu website at:
http://www.prh.noaa.gov/hnl/pages/aviation.php
For a shorter option, you can type weather.gov/hawaii and click “Aviation” in the left-hand menu.
John Bravender
Aviation Weather Program Mananger
National Weather Service Honolulu
john.bravender AT noaa.gov