
Note: I originally wrote this article for the General Aviation Council of Hawaii January 2015 newsletter, hence the aviation focus. Hopefully you will find it enjoyable and educational as well. –JB
As the forecaster who oversees the aviation weather program at WFO Honolulu, I’m always looking for ways to work with the aviation community to improve the services we provide. Both meteorologists and pilots can benefit from more detailed observations of turbulence around the islands. In this article I’ll outline an idea for a “citizen science” project that could do just that.
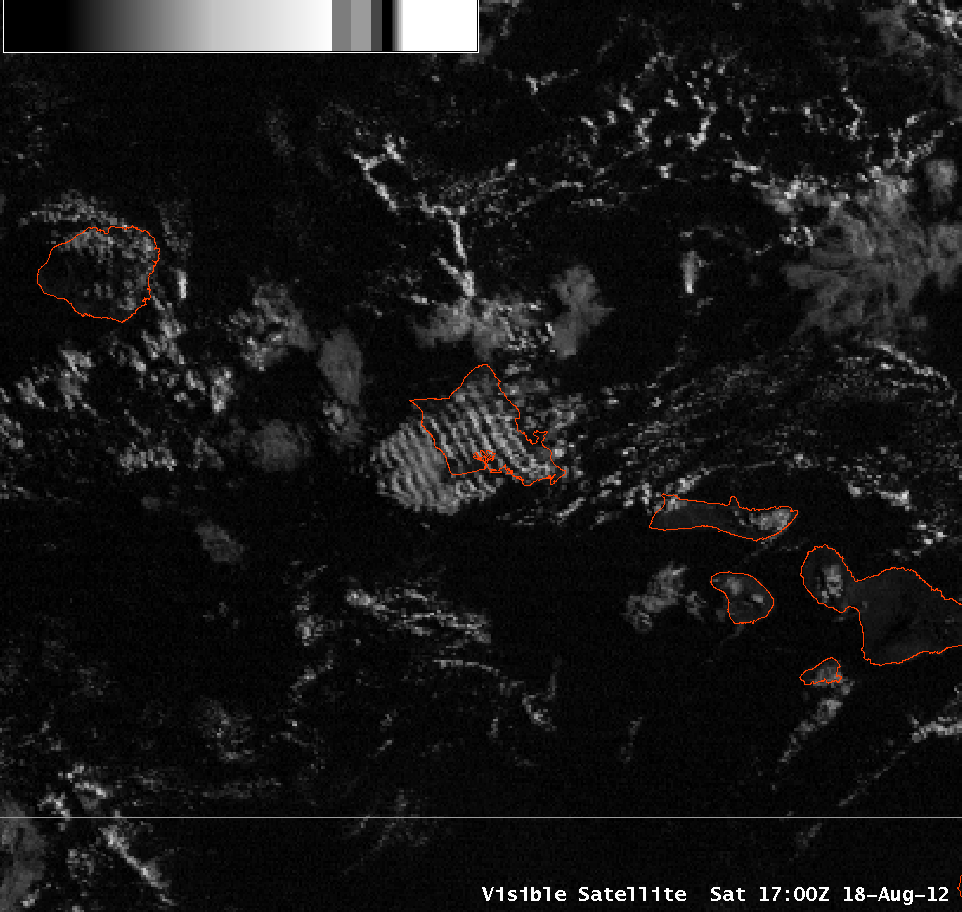
Visible satellite image showing wave clouds over and to the southwest of Oahu. 7am HST, August 18th, 2012.
One thing that forecasters struggle with is how far away from the terrain that turbulence occurs. As mentioned in the January 2012 article on mountain waves, we use general proxies to determine when turbulence may occur—for example, low-level winds of 25 knots or greater—and correlate these with pilot reports. PIREPs are very important in this process, because they are the only way we have to know what is actually occurring. However, PIREPs are usually provided at just one point and the pilot is looking to get out of the turbulence as fast as possible, not trying to see how far it extends. Satellite imagery can help in some instances, but the cloud features that indicate turbulence—such as wave clouds extending downstream of the mountains, as seen over and to the southwest of Oahu in this image—aren’t always present. We need some way to get more information about where turbulence occurs.
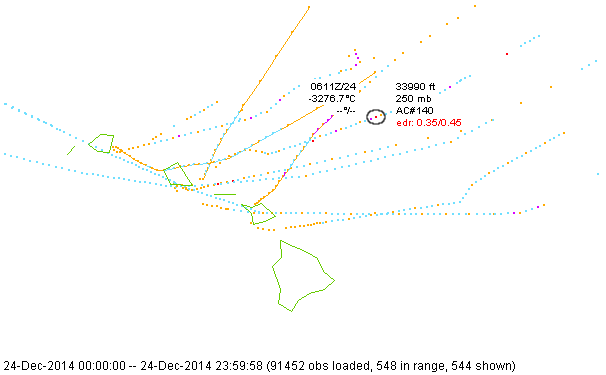
Aircraft reporting eddy dissipation rate (EDR) from December 24th, 2014.
Increasingly, large aircraft are being equipped with instrument packages that include accelerometers. An algorithm was developed that uses the vertical acceleration of the aircraft to estimate a parameter called eddy dissipation rate (EDR). It provides an objective measure of how much turbulent motion the aircraft encounters, and is continuous along the flight track. The adjacent image shows a number of flights reporting EDR from December 24th, 2014. The blue and orange dots indicate no turbulence, magenta indicate light to moderate turbulence, and red (like the one circled) indicate moderate to severe turbulence. However, there is no need to resort to expensive new equipment to get this type of measurement. Many of us have smart phones that can do the same thing.
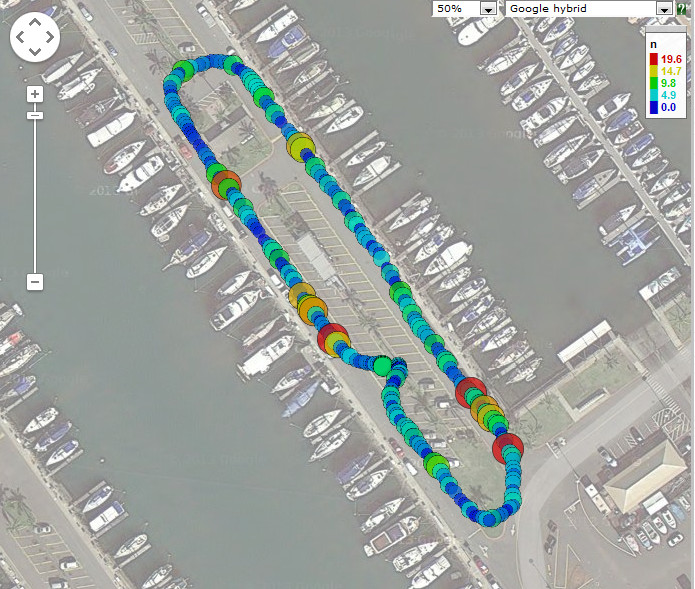
Map of bicycle “turbulence” measured using a smartphone accelerometer.
The adjacent map shows a short bicycle ride that I took using the accelerometer in my phone to measure the bumpiness of the route. The larger orange and red circles are bumpier conditions: potholes in the lower right, speed bump in the upper left, and embedded reflectors in the lower left. (The data were plotted using GPS Visualizer). Something similar could be used in aircraft as well. By using an app that logs GPS, altitude, and acceleration, we can get a measure of how much turbulence occurred and where it occurred during the course of a flight. We also need to normalize the data. (What does “20 [units]” mean after all?) For the commercial aircraft mentioned above, they use a mathematical model to determine how the aircraft responds to turbulence. However, this can also be done in a subjective manner. The pilot can take the flight track and highlight a few points—it was smooth in these areas, I had light turbulence here and here, and at this point I encountered moderate. With a few reference points, we can apply those values to the rest of the route and get turbulence observations for the entire flight track.
This would be an immense help to forecasters, since it will show us in much greater detail where turbulence occurs and how it changes across the area. The information can also be made available to other pilots (as an aggregate product, stripped of identifying information) in near real time as a flight planning tool, as well as part of a climatology that can help new pilots learn of dangerous areas to avoid.
However, this is just an idea right now—which is why this article includes a bicycle track instead of a flight track. Eventually we’ll be looking for pilots who want to participate by measuring data as they fly. In the meantime I would love to hear comments or suggestions. Is this something that is feasible? Is it something that you’d be willing to do on a regular basis? As I mentioned, this is just the starting point of the process, and now is one of the best times to share your insight and expertise to help make it successful.
Thanks for your help!
John Bravender
Aviation Program Manager
National Weather Service Honolulu