Note: I originally wrote this article for the General Aviation Council of Hawaii Fall 2014 newsletter, hence the aviation focus. Hopefully you will find it enjoyable and educational as well. –JB
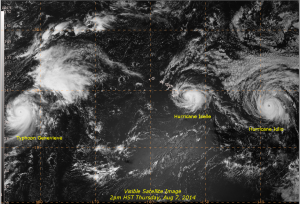
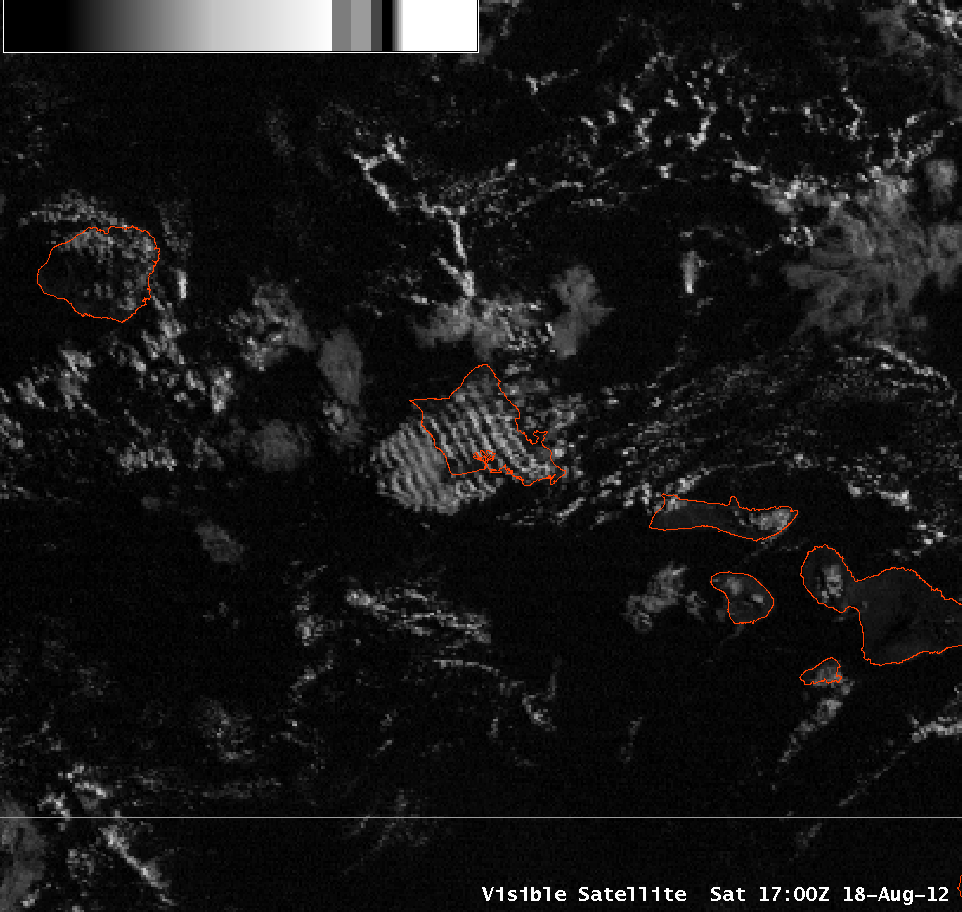
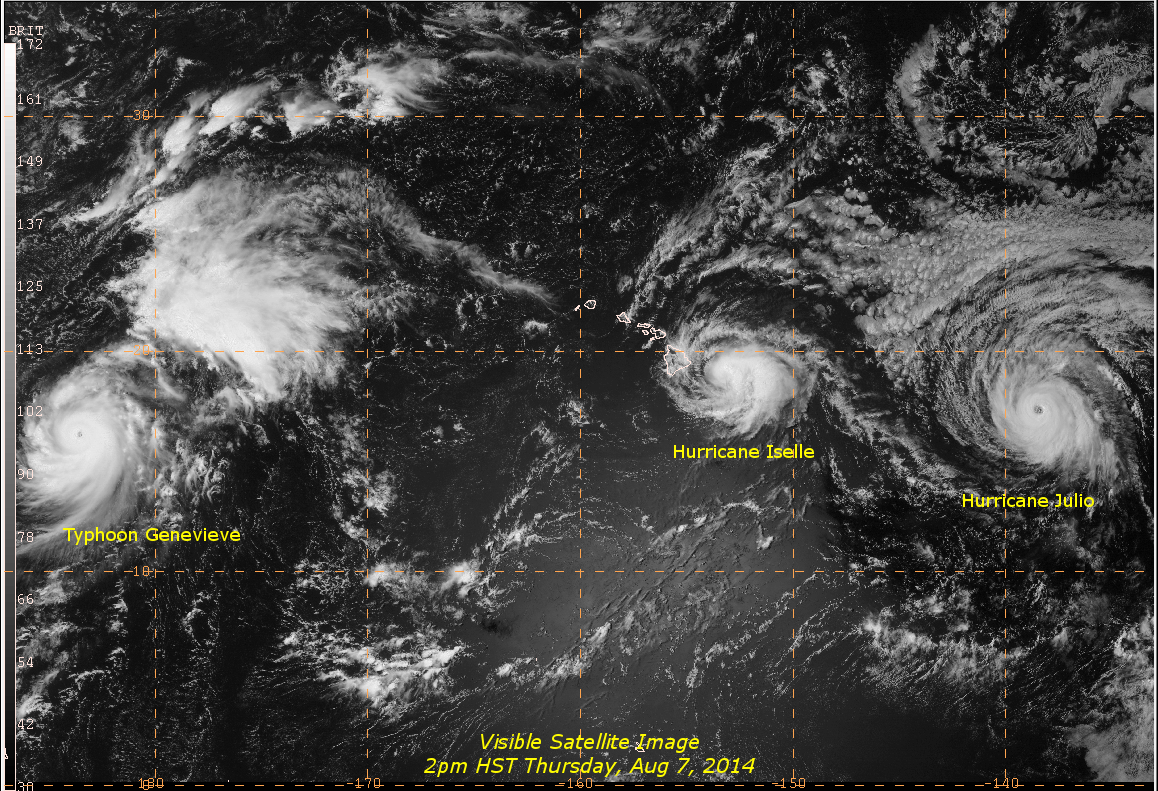
Visible satellite image showing Hurricanes Iselle and Julio in the Central Pacific and Typhoon Genevieve just west of the dateline. Image taken 2pm HST Thursday, August 7, 2014.
The 2014 Central Pacific hurricane season started off with a very active period from late July through mid August. As Genevieve sputtered south of the state, it became clear that Iselle and Julio had the potential to be a significant threat to Hawaii. During most situations, forecasters at the Central Pacific Hurricane Center in Honolulu rely on satellite imagery to estimate the position and intensity of tropical cyclones. However, when there is the threat of a cyclone making landfall, NOAA and the U.S. Air Force Reserve will dispatch aircraft to fly into the cyclone. Instead of having to infer the intensity of a system from satellite, aircraft reconnaissance provides actual measurements.
This article will take a look at the organizations and aircraft that fly into tropical cyclones, the types of equipment that they use to help meteorologists make more accurate and timely forecasts, and how it all came together during the first tropical storm landfall in 22 years in Hawaii.
Organizations and Aircraft
There were two organizations performing reconnaissance on Hurricanes Iselle and Julio: the U.S. Air Force Reserve’s 53rd Weather Reconnaissance Squadron and the NOAA Hurricane Hunters. The 53rd WRS flies WC-130J Super Hercules turboprops, and NOAA flies two WP-3D Orion turboprops and a Gulfstream IV-SP turbofan jet. The turboprop aircraft are used for flying through a hurricane, while the jet is used to sample the environment outside of a hurricane.

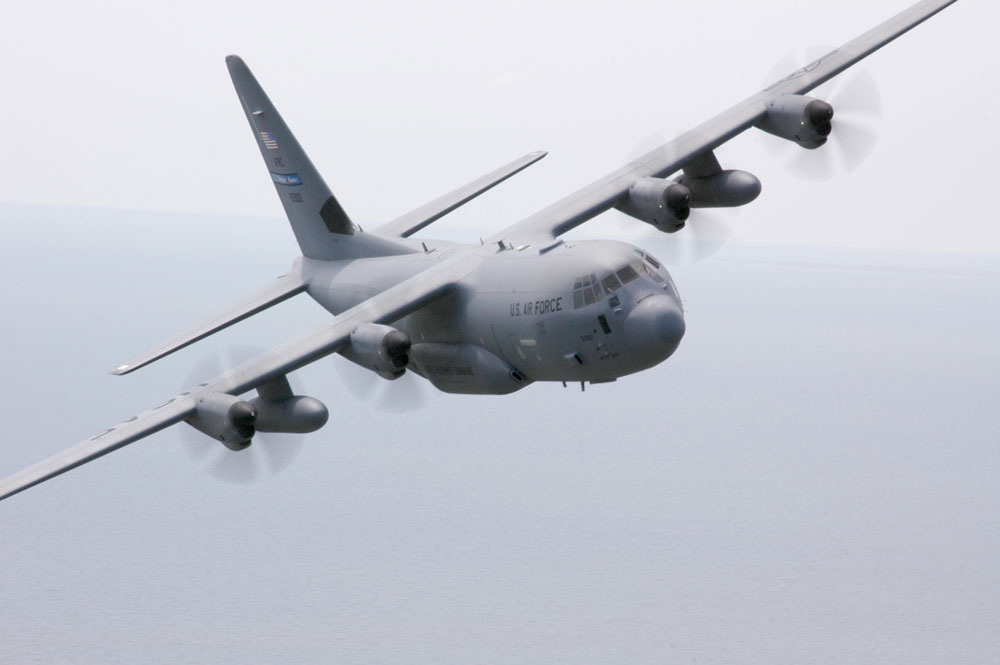
WC-130J Super Hercules flown by the 53rd Weather Reconnaissance Squadron “Hurricane Hunters”
The USAFR 53rd WRS “Hurricane Hunters” are based out of Keesler Air Force Base in Biloxi, MS. They operate 10 WC-130Js, and deployed four of their planes to Joint Base Pearl Harbor-Hickam. They flew tracks through both Iselle and Julio, identifying the center position and strongest winds/lowest central pressure as well as the structure and size of the wind field. Typical missions last about 10 hours, and normally include center position fixes every few hours. The data collected by the aircraft is transmitted in bursts as it is collected, and is available to hurricane specialists—and the general public—in near-real time.

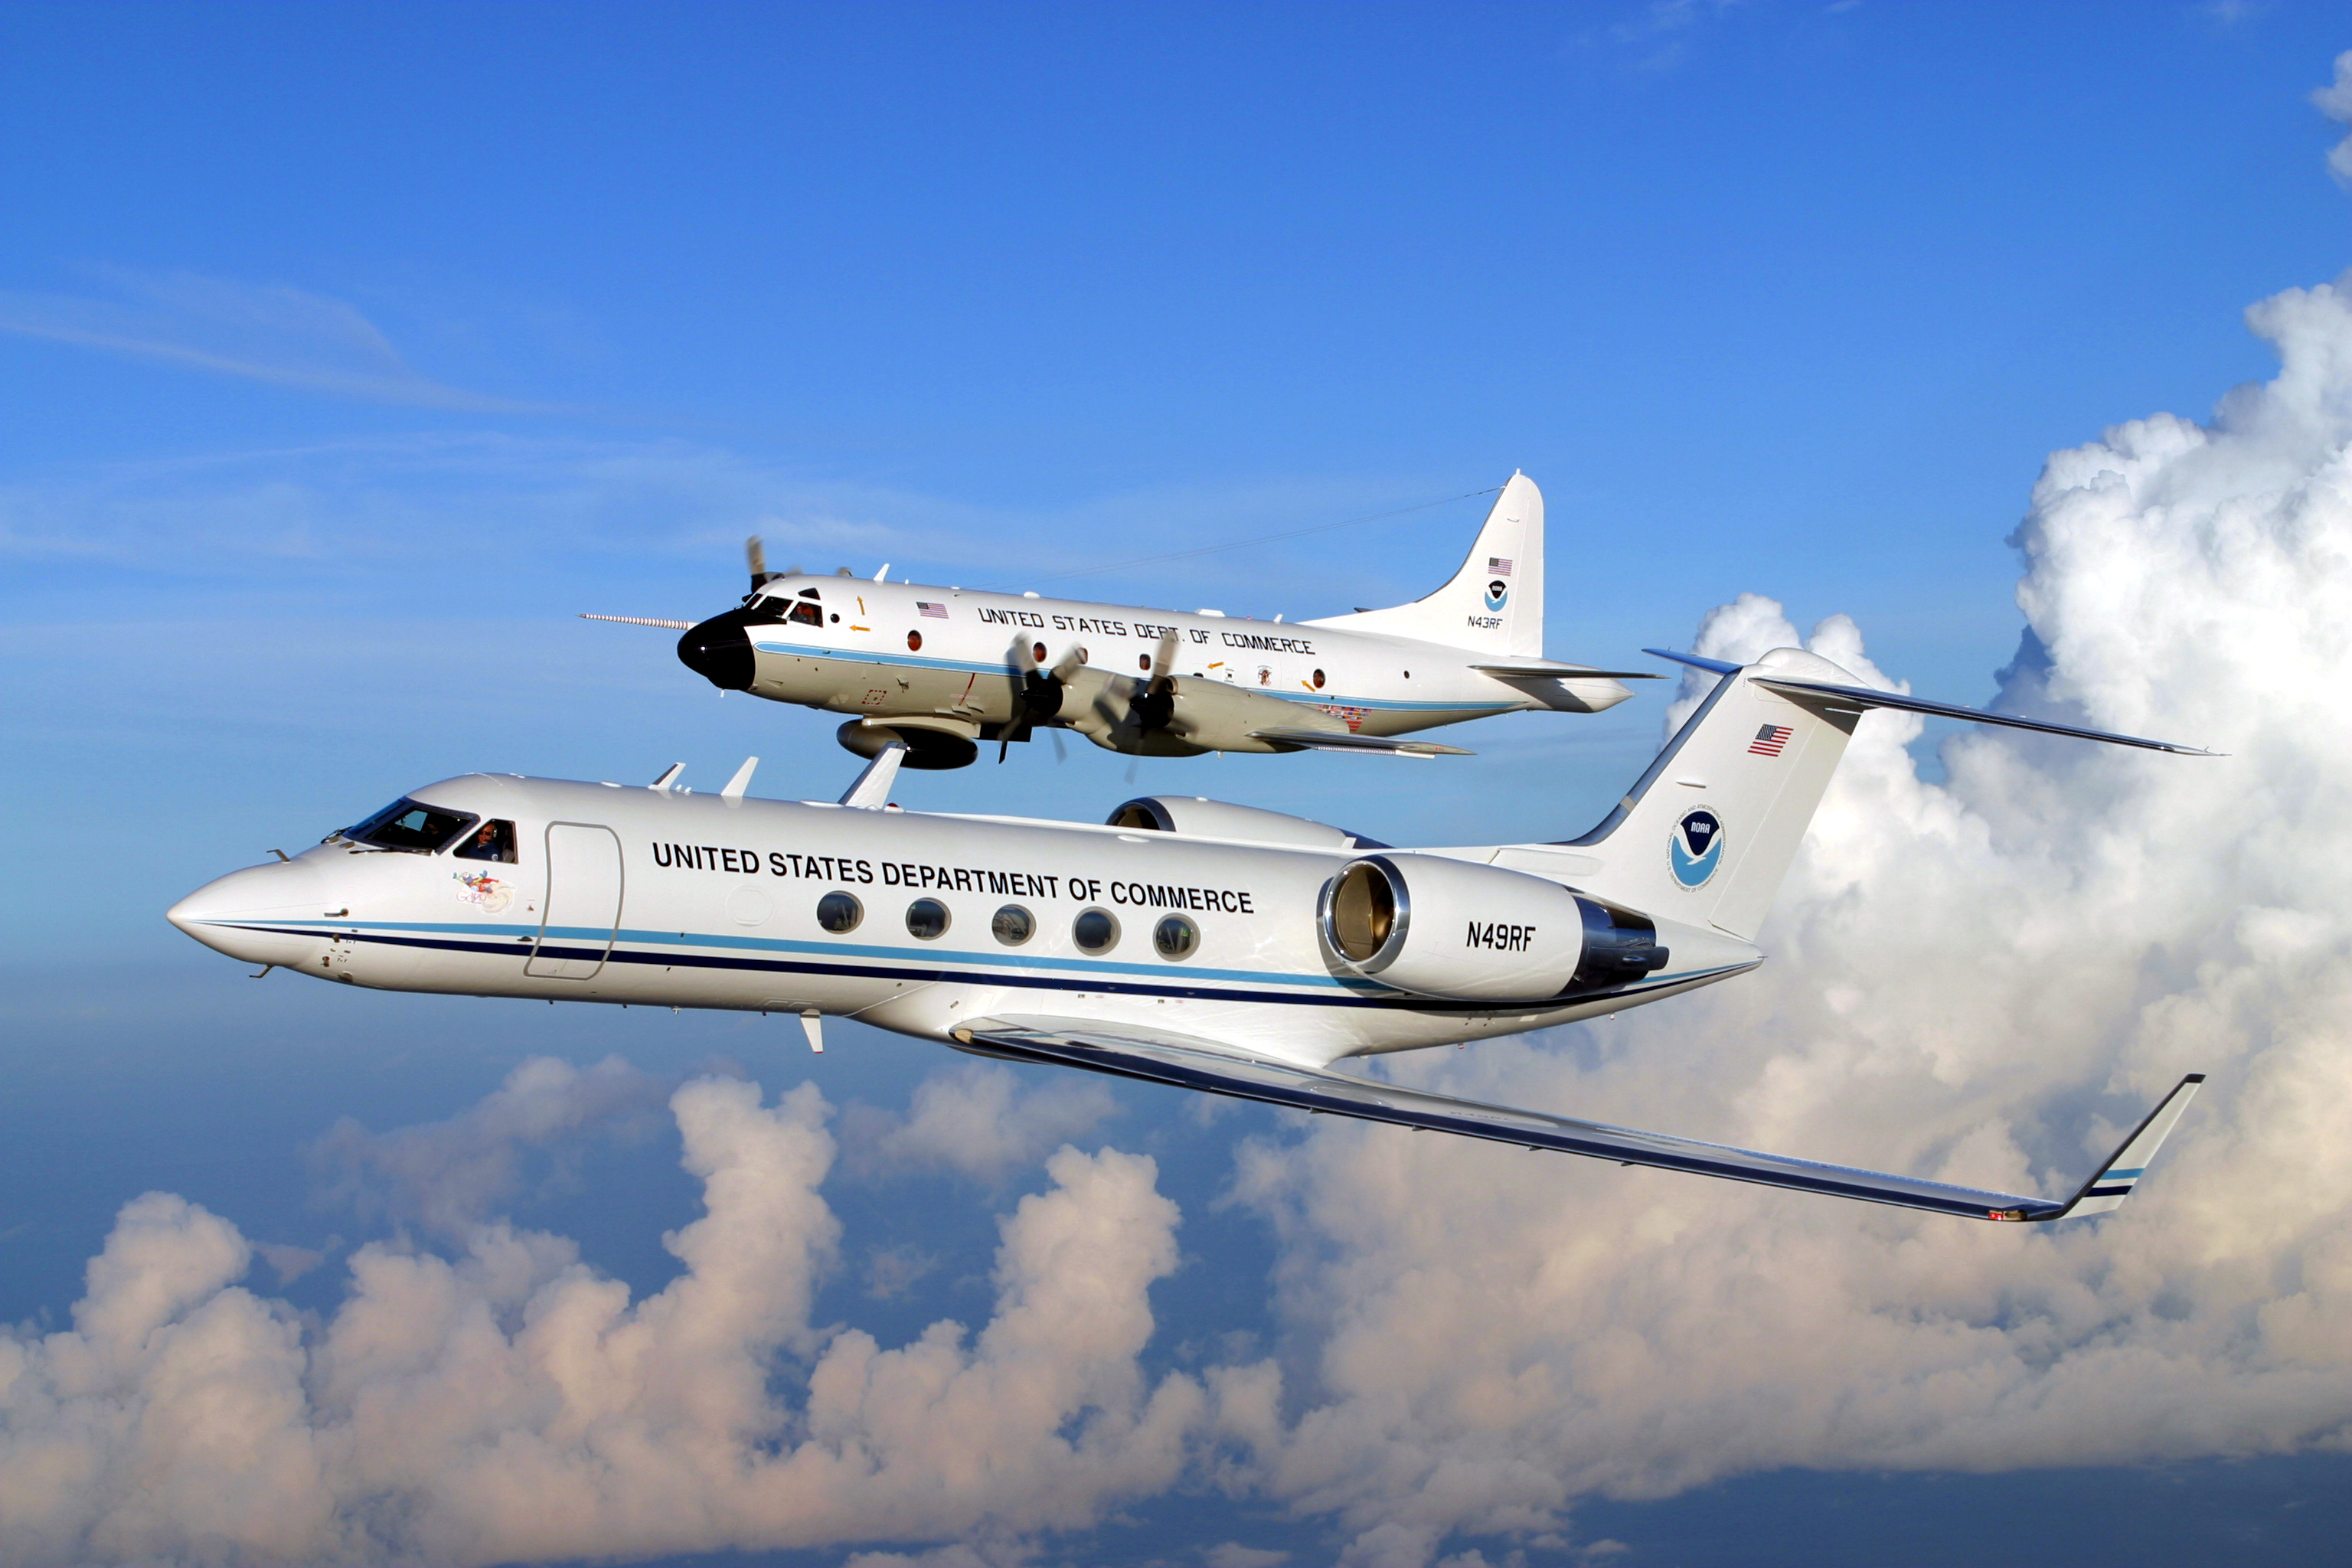
Gulfstream IV-SP and WP-3D Orion flown by the NOAA Hurricane Hunters
The NOAA Hurricane Hunters are managed by the NOAA Aircraft Operations Center, based out of MacDill Air Force Base in Tampa, FL. They operate two types of aircraft for hurricane research: two WP-3Ds (nicknamed “Kermit” and “Miss Piggy”) and one Gulfstream IV-SP (a relatively recent addition, nicknamed “Gonzo”). In terms of Iselle and Julio, it was the Gulfstream that provided reconnaissance. “Gonzo” samples the environment around a cyclone, and the data it collects is included in the computer models that hurricane specialists use to forecast the track and intensity. (Research has shown that proper sampling of the atmosphere around a cyclone can improve the track forecast by up to 25% within the first two days.)
Weather Observations
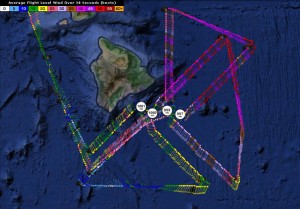
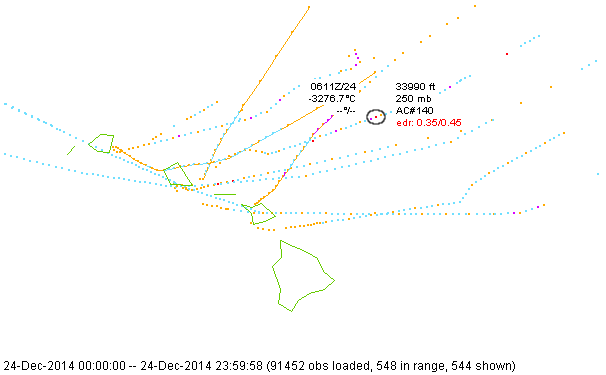
Flight level winds (10,000 feet) and vortex center fixes from mission #7 into Iselle Thursday evening, August 7, 2014. This was the mission that determined Iselle had weakened to a tropical storm just before landfall.
Weather instruments on the aircraft provide continuous observations of winds, temperature, and dew point at flight level. Using an empirically derived reduction value, the flight level wind can be used to approximate the surface wind. The surface wind is about 90% of the flight level wind at 10,000 feet, or about 80% of the flight level wind at 5,000 feet. (It might sound strange to reduce the lower altitude winds more, but because of the unique structure of a hurricane, the strongest winds are located at about 1,500 feet.)
To actually measure the wind at the surface, the aircraft carry instrument packages called dropsondes. These instruments are similar to those used with weather balloons. However, instead of being attached to a balloon and measure the atmosphere from the surface upward, they are attached to a parachute and measure the atmosphere from the plane downward. They measure temperature, dew point, wind speed and direction, and pressure. Multiple sondes are dropped throughout a mission, with at least two released during a center fix (one as the flight passes in through the eye wall, and one as it passes out through the other side of the eye wall).
One of the newer additions to the observation equipment is the Stepped Frequency Microwave Radiometer (SFMR). Whereas a dropsonde can only measure the wind at one point, the SFMR provides a continuous measure of winds at the ocean surface below the plane. It detects naturally emitted microwave radiation from sea foam, which it uses to calculate wind speed and direction. It can also estimate rainfall intensity.
A Doppler radar in the nose of the aircraft also provides information on the reflectivity and velocity structure of the cyclone. This information lets forecasters know how well organized a cyclone is and how it’s changing over time. For example, ragged looking rain bands that start to become more organized indicate a cyclone is strengthening. The radar observations are also used to improve the initial starting point for the computer simulations. (The better picture you have of the current state of the atmosphere, the better the computer model will perform.)
Flight Tracks
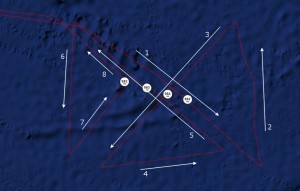
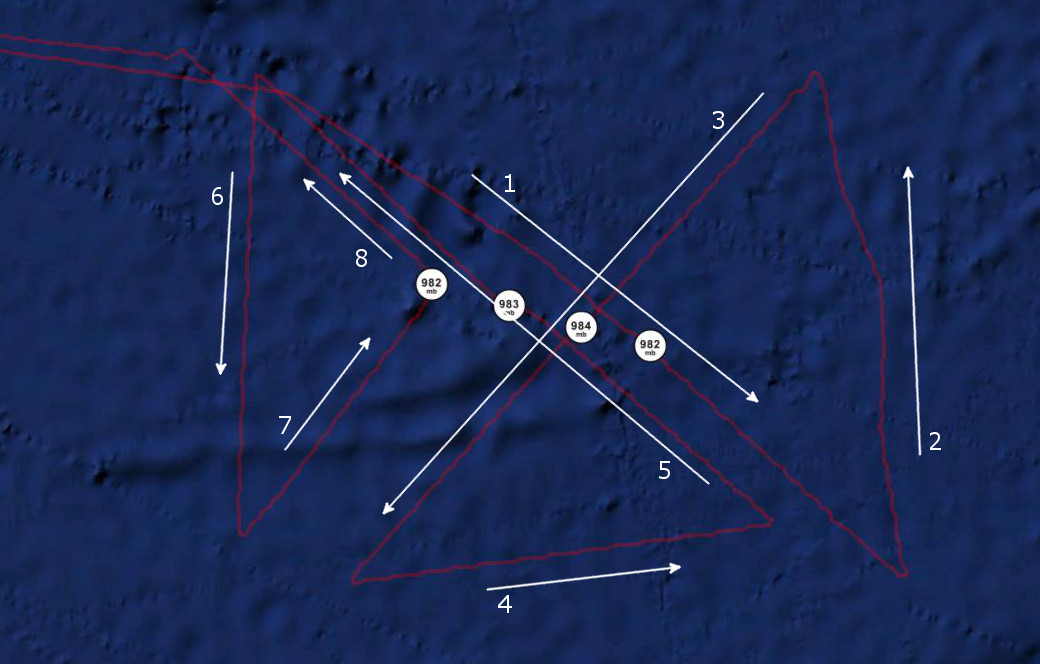
Flight track from mission #3 into Hurricane Iselle from Wednesday, August 6, 2014. White arrows show the direction of flight.
The USAFR Hurricane Hunters fly through the center of the cyclone to measure the strongest winds and lowest pressure, as well as get an accurate center position. They fly what is known as an alpha pattern (based on its resemblance to the Greek letter α). Each leg is normally just over 100 nautical miles long, and is flown on diagonal tracks (NW-SE, SW-NE). This image shows the flight track from mission #3 into Hurricane Iselle from August 6th, 2014. The plane entered the cyclone from the northwest, and proceeded to complete two alpha patterns, providing four separate eye penetrations. These are denoted by the white circles; the number is the minimum central pressure that was measured in the eye. The times of the four fixes were 17:45 UTC (7:45 AM HST), 19:44 UTC, 21:21 UTC, and 23:01 UTC, or roughly an hour and a half to two hours between fixes. During this mission, they also released seven dropsondes during the eye penetrations.
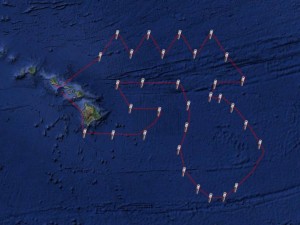
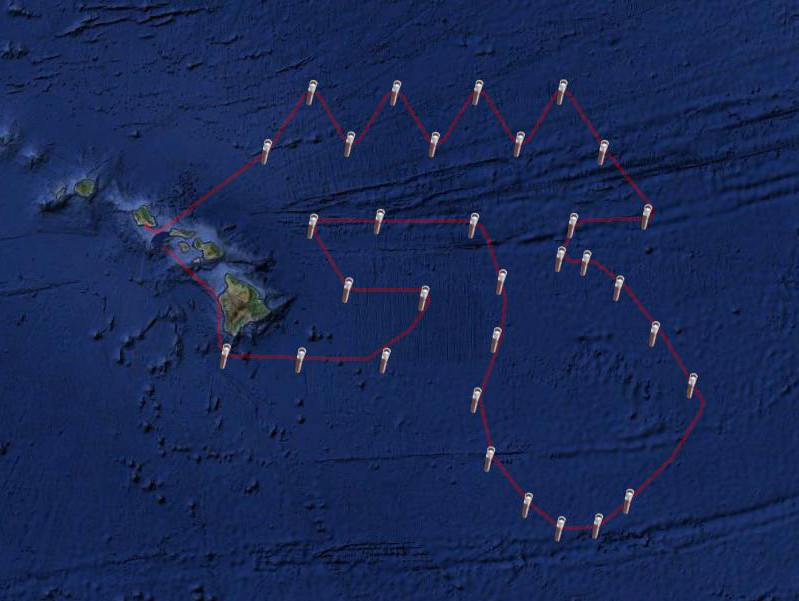
Flight track from mission #4 into Hurricane Iselle from Wednesday, August 6, 2014. The flight departed northeast from Oahu, proceeded clockwise around the hurricane, and returned south of the Big Island.
The NOAA Hurricane Hunters WP-3D aircraft fly through cyclone centers, similar to the WC-130Js. However, the Gulfstream is used to sample the environment around a cyclone. Instead of crisscrossing through the eye of a hurricane, they fly around it, releasing dropsondes around the periphery. They also release a number of sondes ahead of the cyclone, in order to get a better picture of the environment that it will be moving into. This image shows the flight track from mission #4 into Hurricane Iselle from August 6th, 2014. During this flight they made 32 drops. The first one was northeast of Maui at 18:11 UTC (8:11 AM HST), and the last one was just south of the Big Island at 00:22 UTC.
Landfall
Iselle made landfall at about 2:30 AM HST Friday morning, August 8th, 2014, along the Kau coast of the Big Island, approximately five miles east of Pahala. Earlier in the evening, aircraft reconnaissance only measured maximum flight level winds of 60 knots and maximum surface winds of 57 knots, and the aircraft radar saw no discernable eye wall. Since a hurricane is defined as having winds of 64 knots or greater, Iselle had weakened to a tropical storm just before landfall. Even with the weakening trend, there was significant wind damage across Puna District on the Big Island and across upcountry areas on Maui. Heavy rain also caused flooding problems, which were greatest across Kau District where the center of the circulation moved onshore. Several rain gages over the upper slopes of South Hilo and Puna Districts received over 10 inches of rain.
Iselle weakened rapidly after interacting with the terrain of the Big Island. A low-level circulation center redeveloped west of the Big Island early Friday morning, but the system never regained its earlier organization. Tropical storm warnings for the smaller islands were cancelled Friday afternoon, and all tropical bulletins were discontinued Friday night.
Just When You Think It’s Over
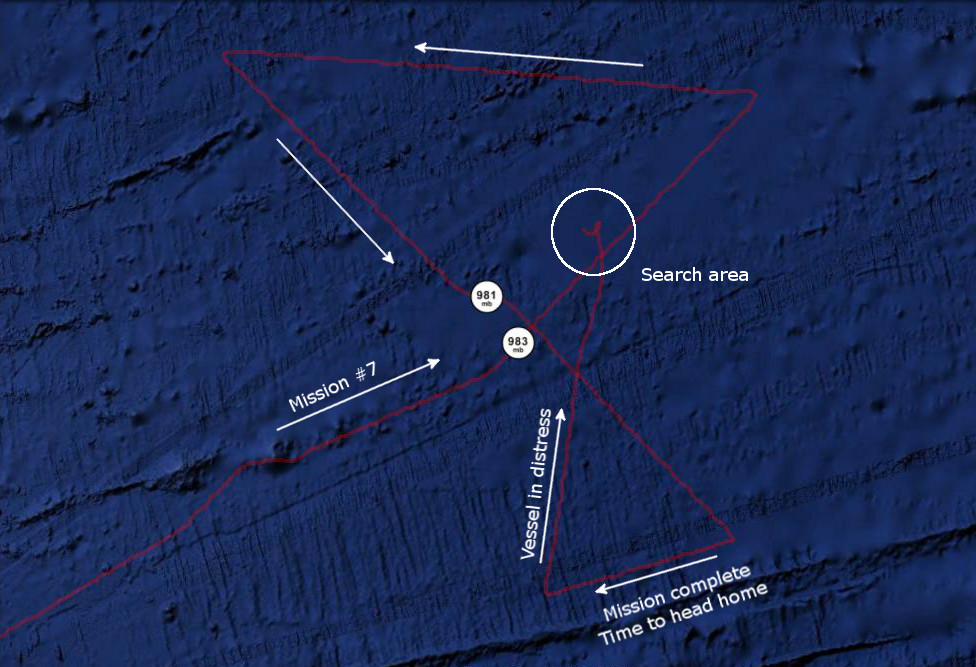
In the days leading up to landfall, it looked like Iselle and Julio could pack a one-two punch. After going 22 years without a landfall, it was possible that we could have two in just a couple days. However, by Sunday, August 10th, 2014, it became clear that Hurricane Julio would stay northeast of the state and not impact Hawaii or other U.S. interests. Therefore, the decision was made to end reconnaissance, and mission #7 was deemed complete after only two of the four scheduled fixes.
As the plane began to return to Honolulu, the U.S. Coast Guard received a distress call from a sailboat near the center of the hurricane. The boat had lost its engine and was taking on water. The location they provided was just northeast of the eye, which, for a northwestward moving hurricane, is the area with the most dangerous seas. It was also an area where the reconnaissance aircraft had just measured 55 knot winds at the surface.
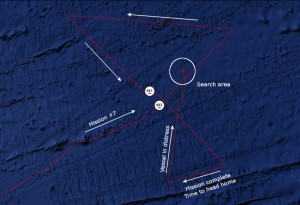
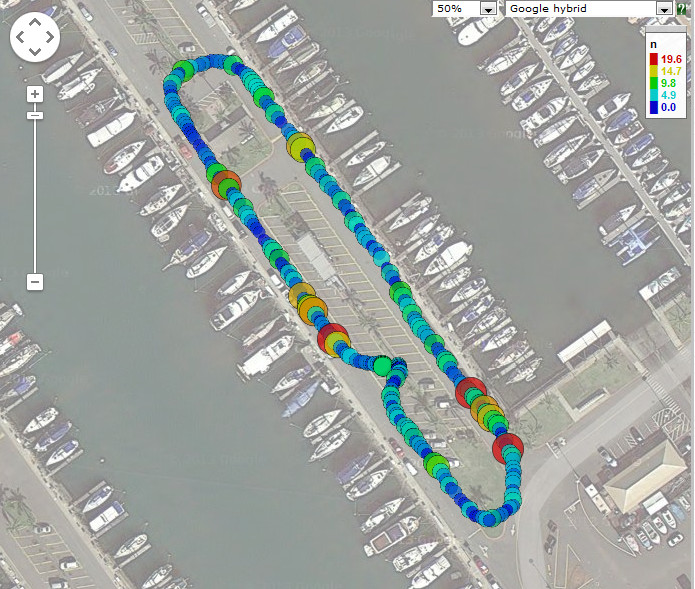
Flight track from mission #7 into Hurricane Julio from Sunday, August 10, 2014. White arrows show the direction of flight, and the white circle highlights the search area.
Communications between the sailboat and the Coast Guard Joint Rescue Coordination Center were spotty at best, and it would take time for the Coast Guard HC-130H from Barbers Point to reach their last reported position and begin a search. The WC-130J, which was just leaving the area of the hurricane, turned around and began the search. Because they had planned for a 10 hour mission that ended up being truncated halfway through, they had fuel to spare. They established radio communication with the boat, and eventually were able to spot them after dropping to a low altitude. Once the boat’s location was confirmed, the mission was turned over to the Coast Guard aircraft, and the Hurricane Hunter returned to Honolulu.
Luckily the crew of the sailboat made it home safely. Although they weren’t able to reach the supplies that the Coast Guard dropped for them, the Matson containership Manukai reached them that night, and brought them aboard first thing Monday morning.
Epilogue and Feedback
Hopefully you enjoyed this article. There’s one more piece of information you might like, which will further allow you to play along at home during the next tropical cyclone. The maps of the reconnaissance data were created using Google Earth, with KML files from Tropical Globe. These files are updated in near-real time as reconnaissance is received. An archive of past reconnaissance observations in available for Iselle and Julio.
Also, we are always looking for feedback. How did Hurricane Iselle affect your aviation operations across the state? Did the products issued by the Central Pacific Hurricane Center and WFO Honolulu meet your needs? Was there anything in particular we did that you really liked? Really didn’t like? What would you like to see in the future with respect to aviation weather services?
Thanks for any feedback you care to provide!
John Bravender
Aviation Program Manager
NOAA/National Weather Service
Central Pacific Hurricane Center
Weather Forecast Office Honolulu