Author Archives: johnbravender

Positive Outlooks

Two atoms are walking down the street.  One turns to the other and says, “I think I’ve lost an electron.”  The second one says, “Are you sure?”  The first replies, “Yes, I’m positive.”

I was having a cup of coffee outside this morning, and started to think about positivity.  (It’s funny how often coffee in the morning leads to positivity…)  A while back Lisa had me watch a TED talk by Shawn Achor.  There are a lot of entertaining TED talks, but I have to say Shawn’s was one of the funniest I’ve seen.  He barely touched on the subjects of his research, but it intrigued me enough to get his book, The Happiness Advantage, where he delves into all the actions he discussed in much more detail.

Unlike getting distracted by a 12 minute video online, it’s been over a year since I read his book, so this isn’t a typical book review where I have it at my finger tips and am quoting passages from it.  I almost think this is better.  Rather than just relaying the highlights that grab you at the time, this is what has stuck with me over the long haul.  Top of the list deals with perception.  We’ve been conditioned by the entire evolutionary process to focus on threats.  Ancient people who focused on the pretty bush and failed to see the wild animal hiding behind it ended up as dinner, not as our ancestor.  Nowadays our threats are different, but we still focus on the negative.

Continue reading

When Weather Radar Measures More Than Weather

Note:  I originally wrote this article for the General Aviation Council of Hawaii Spring 2015 newsletter.  Hopefully you will find it interesting and educational as well. –JB

(For more background on weather radar basics and an overview of the different radars in Hawaii, see the GACH newsletter from Fall 2012.)

Not everything you see on a weather radar image is necessarily a weather feature. Weather radars use a series of complex algorithms to filter out energy from non-meteorological returns. In general terms, if an object is stationary, then it’s most likely not weather-related. For example, a mountain will reflect a lot of energy back to the radar. Luckily, mountains don’t move (much), and the radar will identify and filter out these types of returns. However, no algorithm is perfect, and some returns make it into the final reflectivity product even though they’re not actually precipitation. Here are a few of the more common non-meteorological returns we see in Hawaii:

Continue reading

El Niño and Hawaii Weather

Note:  I originally wrote this article for the General Aviation Council of Hawaii Spring 2014 newsletter. While this seasonal outlook was from last spring, the typical impacts during El Niño remain consistent.  Hopefully you will still find it interesting and useful. –JB

The spring 2014 forecast [view the latest forecast] from the National Weather Service Climate Prediction Center indicates that there is a greater than 50 percent chance that El Niño conditions will develop during the summer of 2014, and continue into the winter of 2014-2015. What is El Niño and what does it mean for weather in Hawaii?

Continue reading

Trade Winds

Note:  I originally wrote this article for the General Aviation Council of Hawaii Winter 2014 newsletter, hence the aviation focus.  Hopefully you will find it interesting and educational as well. –JB

In the last article we discussed severe weather features such as tornadoes and water spouts. These weather phenomena are not common, especially in Hawaii. For the bulk of the year our weather is driven by the trade winds. In this article we’ll take a look at what drives the trades, how they affect our weather, and the types of impacts to aviation that we may see from them.

Continue reading

Rotating Columns of Air: Tornadoes, Waterspouts, Funnel Clouds and Dust Devils

Note:  I originally wrote this article for the General Aviation Council of Hawaii Fall 2013 newsletter, following a particularly busy couple of weeks.  Hopefully you will still find it interesting and educational. –JB

During a period of unsettled weather at the beginning of this month [October, 2013], National Weather Service spotters have reported water spouts, funnel clouds, and dust devils on many different days. We have also received a number of questions about the differences between these features and others, such as tornadoes. This is a good opportunity to review the differences between these features, and look at the hazards to aviation that they pose.

Continue reading

Introduction to Satellite Imagery

Note:  I originally wrote this article for the General Aviation Council of Hawaii Spring 2013 newsletter.  Hopefully you will find it interesting and educational as well. –JB

Satellite imagery is very useful for identifying, tracking, and forecasting weather systems. It is even more important in Hawaii, given our remote location and lack of nearby observations.

Geostationary Satellites

Some of the most common types of satellite images are from geostationary satellites. Geostationary satellites orbit the Earth over the equator at an altitude of about 22,300 miles. At this altitude, the speed of the satellite matches the rotation of the Earth, and the satellite remains over the same location on the surface. Because it remains stationary over the same location, a geostationary satellite can provide constant monitoring of clouds and weather patterns.

Continue reading

Low-Level Turbulence Climatology

Note:  I originally wrote this article for the General Aviation Council of Hawaii Winter 2013 newsletter. The results weren’t quite what I expected, but still proved interesting. Instead of highlighting where turbulence occurs, the pilot reports instead highlighted areas where aircraft tend to fly (i.e., Oahu, mainly with reference to HNL or CKH). –JB

In the Winter 2012 newsletter, I talked about mechanical turbulence and mountain waves. Moderate turbulence is the most common reason for an AIRMET around the Main Hawaiian Islands. In the 12 year period from 2001 to 2012, an AIRMET for turbulence was in effect for at least a portion of the day for over half of the time. By contrast, an AIRMET for mountain obscuration/IFR conditions was in effect for less than a quarter of the time, and an AIRMET for icing was in effect for less than five percent of the time.

Even though turbulence is common, there is little specific information available as to where it occurs (other than “over and downwind of the mountains”). The National Weather Service in Honolulu will begin a project this summer to quantify where turbulence is most likely to be encountered. By taking pilot reports of turbulence and sorting them based on atmospheric stability and low-level wind fields, we will be able to map where turbulence occurs during different weather patterns.

Continue reading

Weather Radar in Hawaii

Note:  I originally wrote this article for the General Aviation Council of Hawaii Fall 2012 newsletter. Had to make a couple tweaks to the dual-polarization section, since upgrades at all Hawaii radars were completed in 2013. –JB

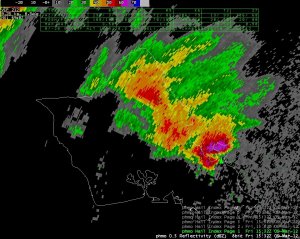
Radar image of a supercell thunderstorm from March 9th, 2012. This storm brought large hail to Kailua and Kaneohe, including a record-setting hailstone that measured 4.25 inches long, and generated a tornado that damaged homes in Lanikai.

Radar image of a supercell thunderstorm from March 9th, 2012. This storm brought large hail to Kailua and Kaneohe, including a record-setting hailstone that measured 4.25 inches long, and generated a tornado that damaged homes in Lanikai.

Weather radars are one of the most effective tools for detecting rainfall. This article includes information about weather radar in general, and about the specific radar sites we have in Hawaii.

Weather Radar Basics

The radar transmits an electromagnetic pulse, which reflects off objects in the atmosphere. (The objects could be anything, not just precipitation; one common problem around Hawaii is with sea spray being detected during windy days.) A small fraction of the energy is returned to the radar. The radar measures how much energy is reflected back, and how long it took to return. The energy is converted into reflectivity, and the time is converted into distance from the radar. Larger or more numerous objects return more energy, and result in a higher reflectivity.

Continue reading

Mountain Turbulence

Note:  I originally wrote this article for the General Aviation Council of Hawaii Winter 2012 newsletter.  Hopefully you will find it interesting and educational as well. –JB

Two common types of turbulence associated with mountains are mechanical turbulence and mountain waves. Mechanical turbulence is a result of an obstruction to the wind flow. Obstructions can range in size from trees and buildings to rough terrain and mountains. The degree of the turbulence depends on the strength of the wind speed and the size and shape of the obstruction. The stronger the wind or the rougher the terrain, the stronger the turbulence will be.

Mechanical turbulence usually occurs within 20 miles of the mountain, and is located at an altitude near or below the height of the terrain. As a rough estimate, low-level winds of 20 knots may lead to light turbulence, winds of 25 knots may lead to moderate turbulence, and winds greater than 30 knots may lead to severe turbulence.
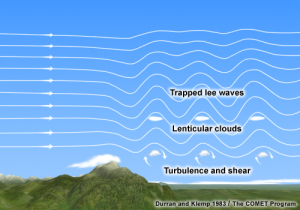
Trapped lee waves downwind of a mountain range.  Image courtesy of COMET/UCAR

Trapped lee waves downwind of a mountain range. Image courtesy of COMET/UCAR

For mountain waves, there are two main types: trapped lee waves and vertically propagating mountain waves. Mountain waves are a type of gravity wave, meaning that they are forced to oscillate because of gravity. (Waves on the ocean are another type of gravity wave.) When strong winds blow across a mountain, the air is forced upward by the terrain. If the atmosphere over the mountain is stable (that is, if the temperature of the air increases with height, which is typically the case in Hawaii due to the trade wind inversion), then the air that is forced upward by the mountain will be more dense than the air around it. The air will sink back toward the ground, where it will begin an up and down oscillation. These oscillations can continue for over 50 miles downstream of the mountain, and are known as trapped lee waves.
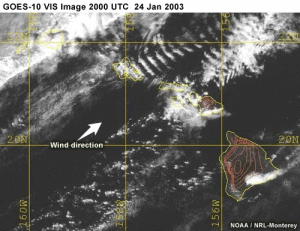
Visible satellite image of wave clouds over and downstream of Oahu under strong southwest winds.

Visible satellite image of wave clouds over and downstream of Oahu under strong southwest winds.

If the atmosphere has enough moisture, the trapped lee waves may be visible as wave clouds. Wave clouds form near the crests of the trapped lee waves, and appear as distinct lines that are oriented parallel to the terrain and perpendicular to the wind. While the clouds may appear to remain stationary, the wind blowing through them is actually quite strong.

Trapped lee waves tend to form when the low-level flow is perpendicular to the mountain range, there is an inversion located near the top of the ridge, and ridge-top winds are 25 knots or greater. Wave clouds typically form at an altitude within a few thousand feet of the ridge top. Turbulence is most often encountered below the crests of the mountain waves, or, in other words, below the wave clouds if they are present.

Trapped lee waves are the most common type of mountain wave in Hawaii, because of the persistence of the trade wind inversion. However, if the atmosphere is unstable, vertically propagating mountain waves may form. In this situation, there is no inversion for the mountain waves to reflect off of to begin the oscillation. Instead, the mountain waves will spread upwards through the atmosphere, and also tilt upstream in the direction from which the wind is blowing. Vertically propagating mountain waves may extend through the troposphere and even into the stratosphere.

The presence of vertically propagating mountain waves does not necessarily mean that there will be turbulence. If the amplitude of the waves becomes large enough, they become unstable and break–just like ocean waves–which leads to turbulence. If the waves don’t break, an aircraft may encounter significant wave action, but not the severe to extreme turbulence that may be encountered within breaking mountain waves.

The conditions necessary for mechanical turbulence and mountain waves are similar: strong winds blowing across a mountain. Whether the cause is mechanical turbulence or mountain waves, the results can be the same: turbulence. As a basic rule of thumb, be alert for turbulence if low-level winds are 25 knots or greater. The National Weather Service will issue an AIRMET if moderate turbulence is expected, and will issue a SIGMET if severe turbulence is expected. When an AIRMET or SIGMET is in effect, the forecaster will also provide the reasoning behind those products in the Area Forecast Discussion. These products (and others) are available through the aviation page of the WFO Honolulu website.

John Bravender
Aviation Program Manager
National Weather Service Honolulu

La Niña and Hawaii Weather

Note:  I originally wrote this article for the General Aviation Council of Hawaii Fall 2011 newsletter. The seasonal outlook no longer applies, but typical impacts during La Niña remain consistent.  Hopefully you will still find it interesting and useful. –JB

The fall 2011 forecast [view the latest forecast] from the National Weather Service Climate Prediction Center indicates that La Niña conditions have returned, and are expected to gradually strengthen and continue into the winter of 2011-2012. What is La Niña and what does it mean for weather in Hawaii this wet season?

What is La Niña?

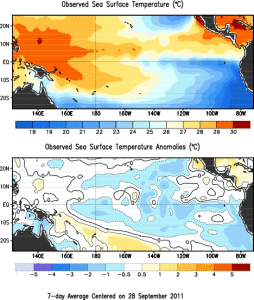
Observed sea surface temperature and SST anomaly from late September, 2011.

Observed sea surface temperature and SST anomaly from late September, 2011.

La Niña is the cold phase of the El Niño/Southern Oscillation (ENSO) cycle. It is identified by colder than normal water along the equatorial Pacific. It is the opposite of El Niño, which is identified by warmer than normal water along the equatorial Pacific. ENSO episodes typically last 9-12 months, and reach their peak strength during late winter (from December to April). The episodes typically occur every 2-7 years. However, it is not uncommon for a strong La Niña (such as the one that occurred during the winter of 2010-2011) to be followed the next year by a weak La Niña.

The changes in the ocean temperature have wide-ranging impacts on atmospheric circulations and weather patterns.

Weather Impacts to Hawaii

During La Niña years, large scale flow across the eastern North Pacific tends to be more amplified. Instead of a zonal (west to east) jet stream, it can develop more of a north/south component. This amplified pattern can cause storm systems to track farther south than normal. In addition, a persistent upper level high is also common over the Gulf of Alaska. This “blocking” pattern can cause low pressure systems to linger over one area for a prolonged period of time.

At the local scale, Hawaii tends to see above normal rainfall and more frequent storm systems during La Niña years. The winter of 2010-2011 occurred during a strong La Niña. There were many heavy rain episodes, including a number of widespread thunderstorm events. The storms continued into early June, well beyond the typical wet season.

There are a number of aviation impacts that are related to the increased number of winter storms that affect Hawaii during La Niña years. Thunderstorms are more frequent near the islands, with their attendant hazards: severe or greater turbulence, severe icing, wind shear, and IFR conditions. Mountain obscurations are more common and can be more persistent. Widespread icing is possible, and icing conditions can be encountered at lower altitudes.

While these hazards occur regardless of the ENSO cycle, they tend to happen more frequently during La Niña years. The current long-range outlook for Hawaii calls for above normal rainfall and above normal temperatures for the second half of the winter. As the wet season progresses, remember to stay up to date with the latest warnings, advisories, and forecasts from your National Weather Service. If you have questions about any NWS forecast products, you can call the office at 808-973-5286. (Just remember that while we can answer your questions, we can’t provide flight briefings.)

John Bravender
Aviation Program Manager
National Weather Service Honolulu